![]()
This is a partial list of tools from Brendan's presentations, book and elsewhere it's up to you to learn how to use them, when and why. Many can show rolling O/P by a 1 sec addition eg mpstat 1
sudo apt-get install sysstat
apt-cache show sysstat
Description-en: system performance tools for Linux
The sysstat package contains the following system performance tools:
- sar: collects and reports system activity information;
- iostat: reports CPU utilization and disk I/O statistics;
- mpstat: reports global and per-processor statistics;
- pidstat: reports statistics for Linux tasks (processes);
- sadf: displays data collected by sar in various formats;
- nfsiostat: reports I/O statistics for network filesystems;
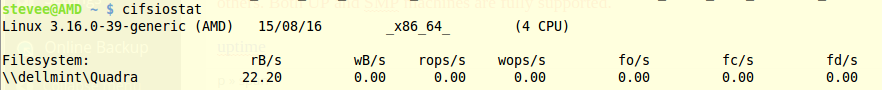
- cifsiostat: reports I/O statistics for CIFS filesystems.
.
The statistics reported by sar deal with I/O transfer rates,
paging activity, process-related activities, interrupts,
network activity, memory and swap space utilization, CPU
utilization, kernel activities and TTY statistics, among
others. Both UP and SMP machines are fully supported.
uptime
11:07:33 up 1:33, 3 users, load average: 0.46, 0.59, 0.69 (1min, 5 min, 15 min)
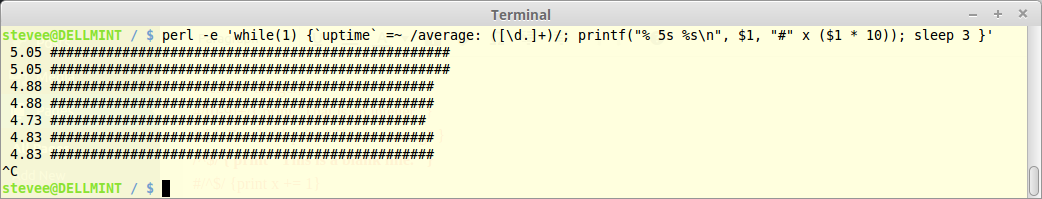
perl -e 'while(1) {`uptime` =~ /average: ([\d.]+)/; printf("% 5s %s\n", $1, "#" x ($1 * 10)); sleep 3 }'
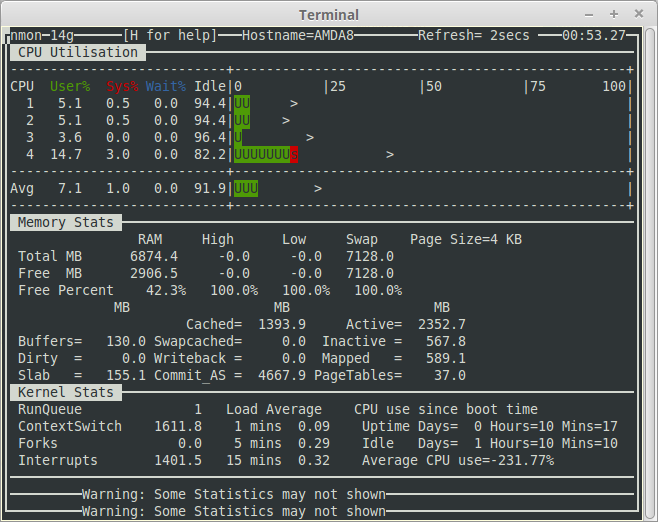
nmon
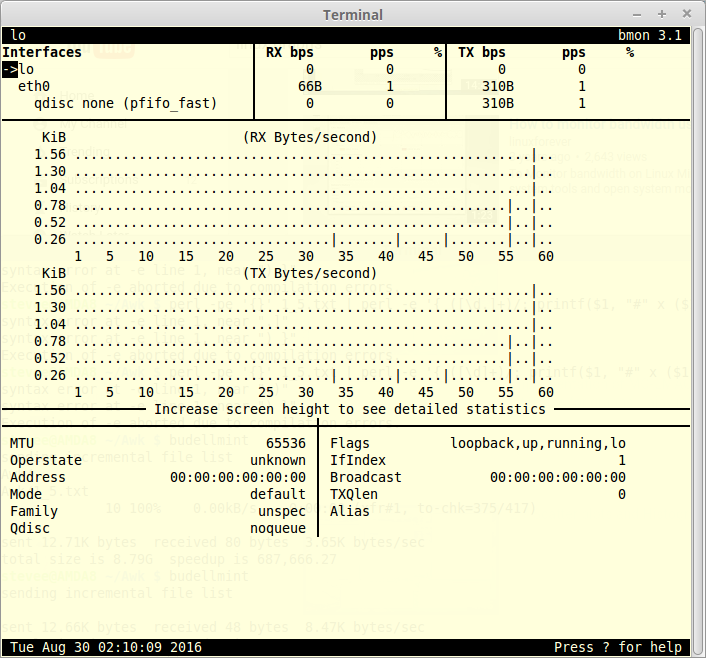
bmon
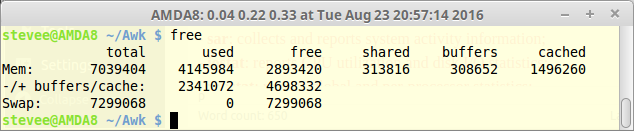
free
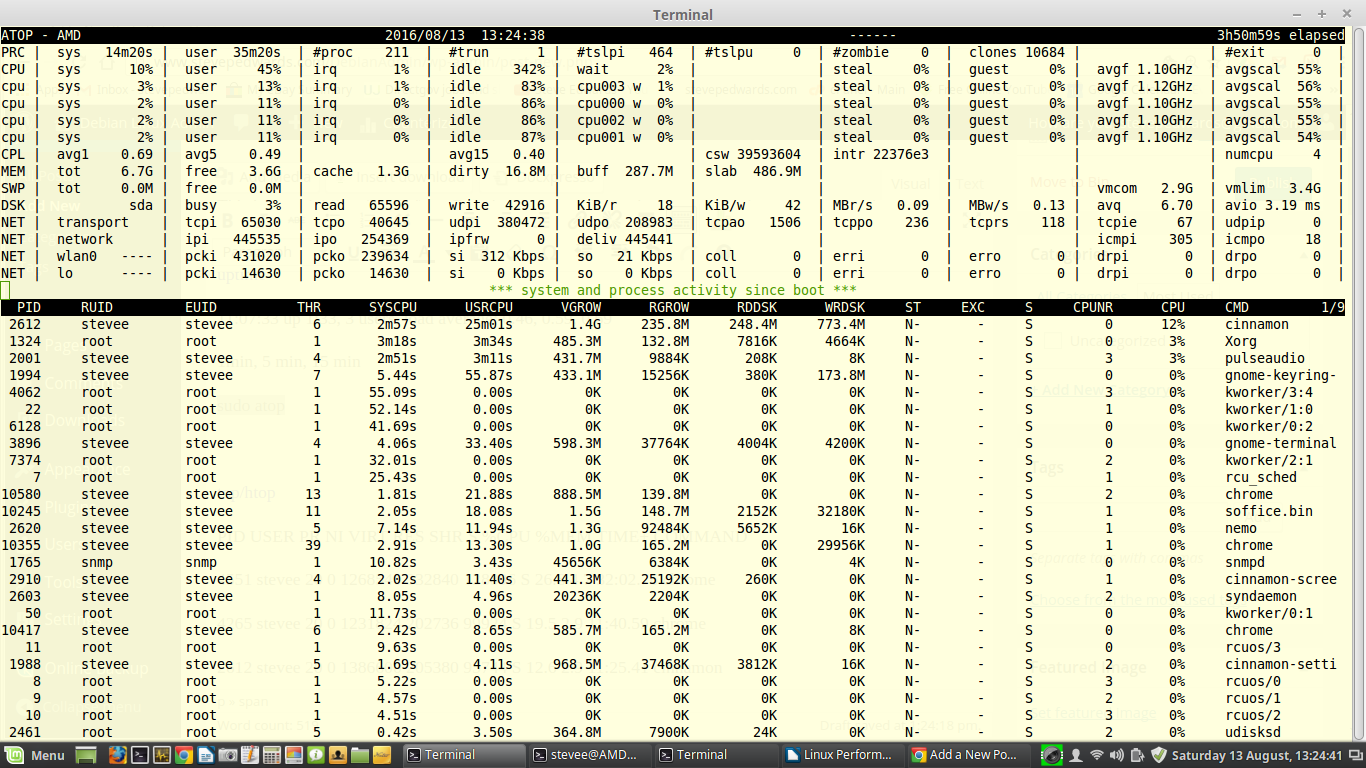
sudo atop
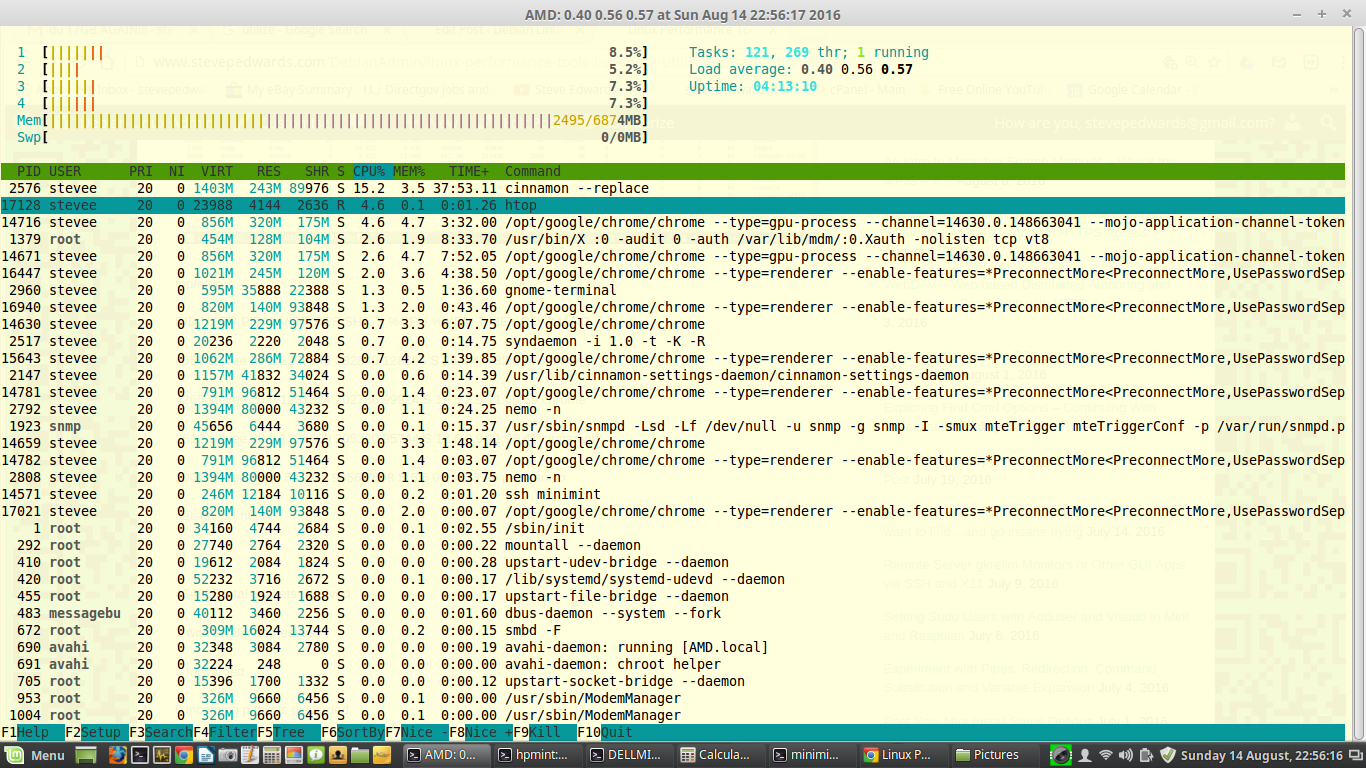
top/htop
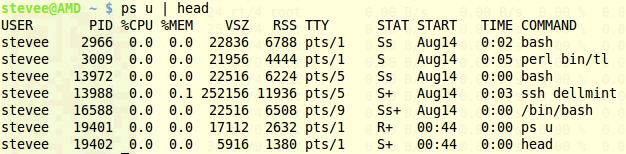
ps u | head
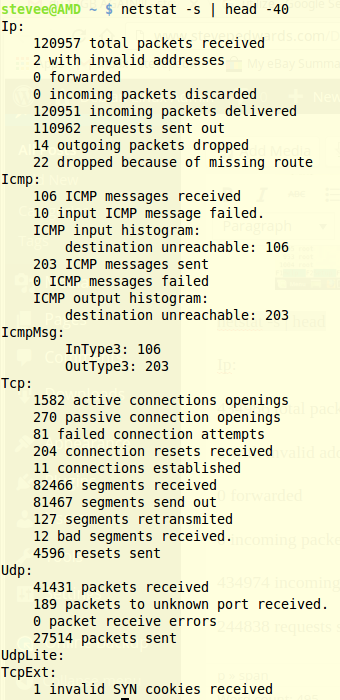
netstat -s | head
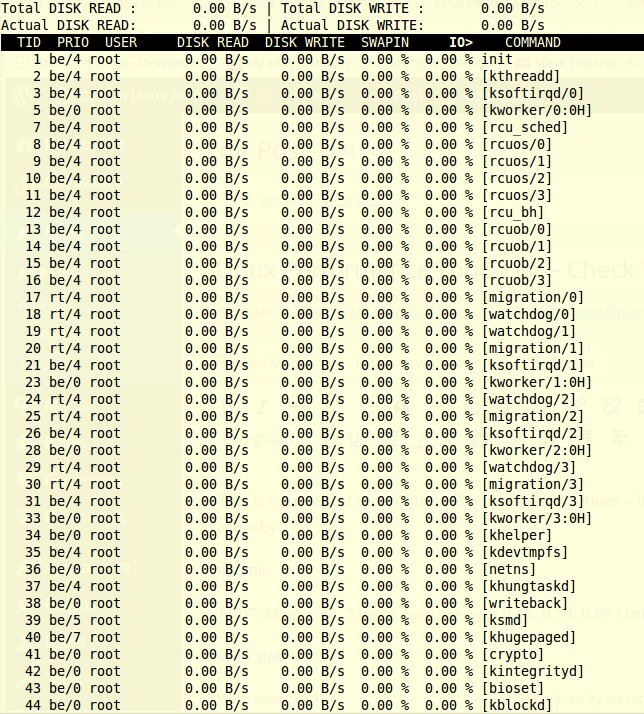
sudo iotop
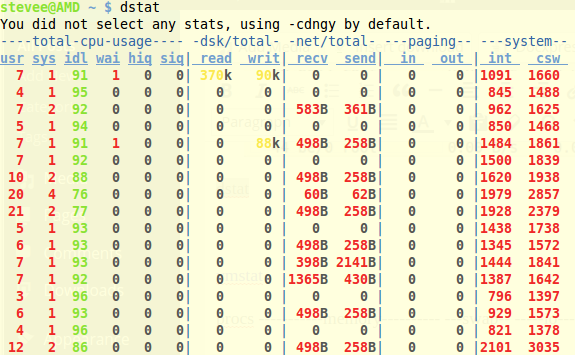
dstat
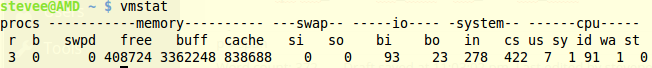
vmstat (-sm)
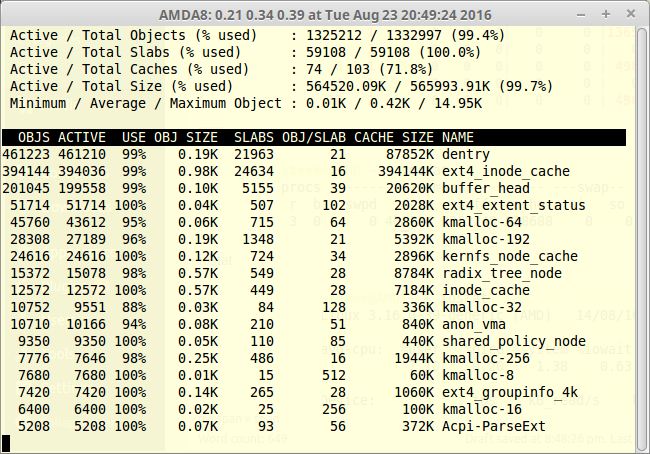
slabtop
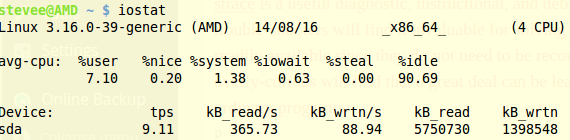
iostat
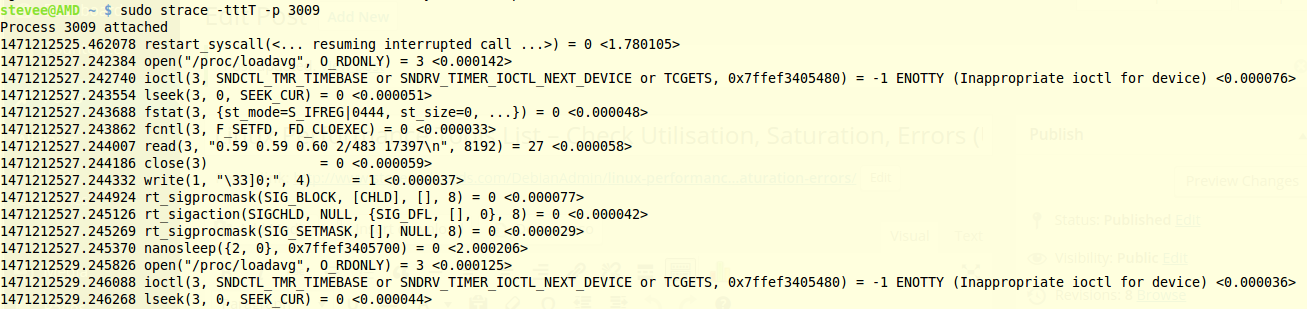
man strace (USE WITH KNOWLEDGE AND CAUTION)
DESCRIPTION
In the simplest case strace runs the specified command until it exits. It intercepts and records the system calls which are called by a process and the signals which are received by a process. The name of each system call, its arguments and its return value are printed on standard error or to the file specified with the -o option.
strace is a useful diagnostic, instructional, and debugging tool. System administrators, diagnosticians and trouble-shooters will find it invaluable for solving problems with programs for which the source is not readily available since they do not need to be recompiled in order to trace them. Students, hackers and the overly-curious will find that a great deal can be learned about a system and its system calls by tracing even ordinary programs.
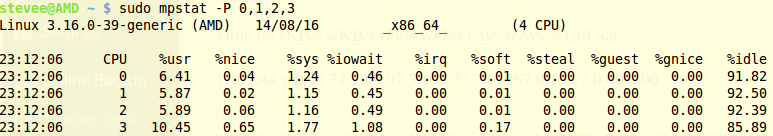
sudo mpstat -P 0,1,2,3
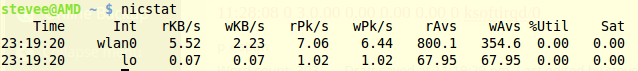
nicstat
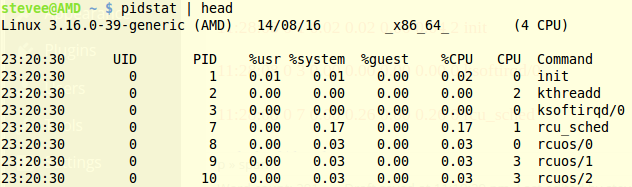
pidstat | head
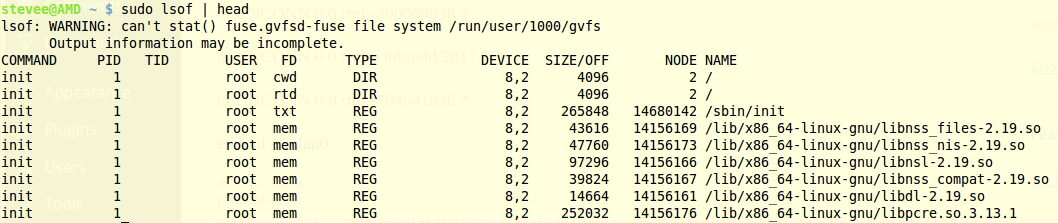
sudo lsof | head
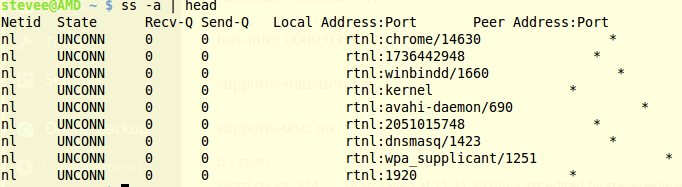
ss -a | head
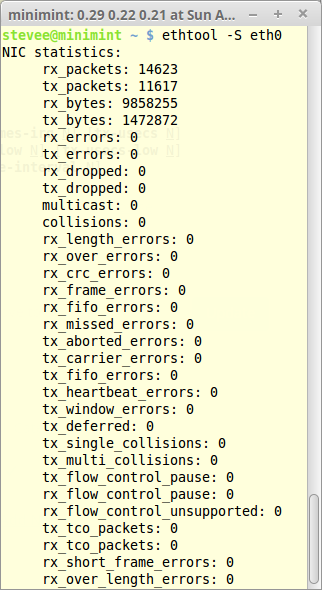
ethtool -i eth0
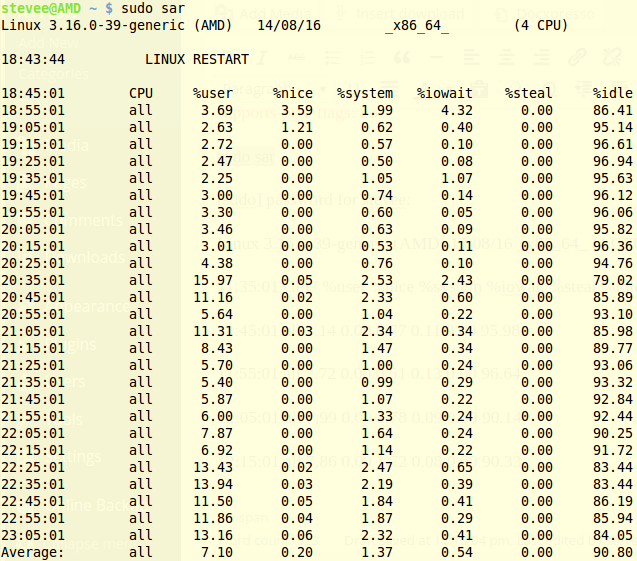
sudo sar (-BHRrSsw)
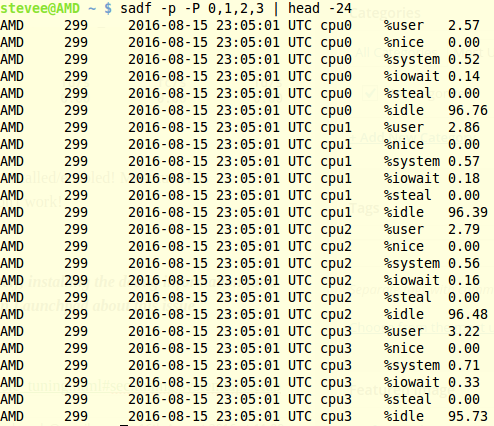
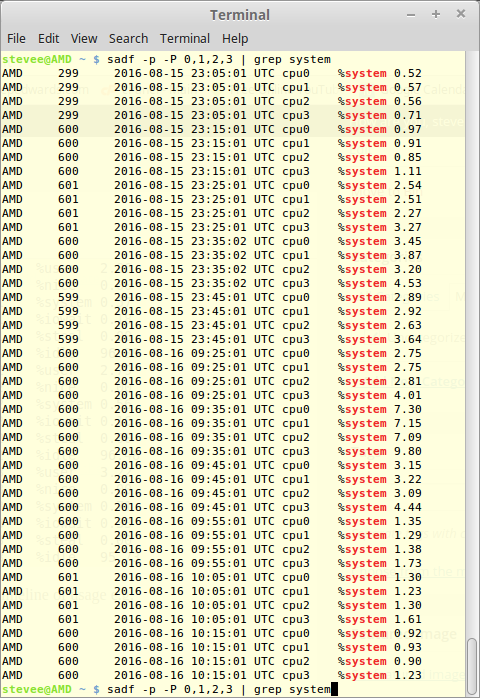
If you run sar, then a nice addition is sadf as it formats sar data for other use - DB, csv etc. For example, it can show 6 cpu utilizations for each 4 cores which can be grepped nicely for an easy summary:
sadf -p -P 0,1,2,3 | head -24
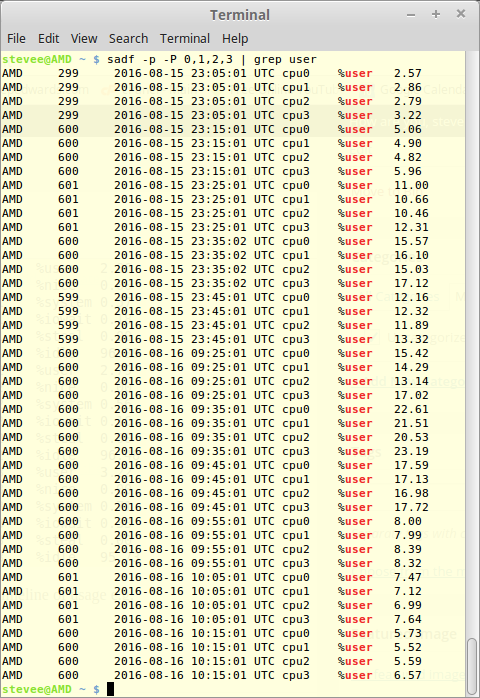
Each usage type can be grepped quickly showing 10 min separations for a clear timeline of usage e.g:
sadf -p -P 0,1,2,3 | grep user
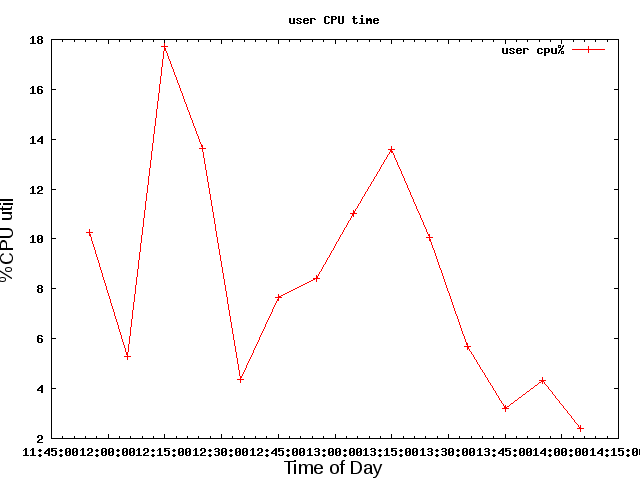
 These columns could be stripped and graphed quite easily via awk / gnuplot etc e.g:
sadf -p -P 0,1,2,3 | grep user | grep cpu0 | awk '{print $3,$4,$7}' > data1.dat
2016-08-17 11:55:01 10.28
2016-08-17 12:05:01 5.27
2016-08-17 12:15:01 17.73
2016-08-17 12:25:01 13.63
2016-08-17 12:35:01 4.38
2016-08-17 12:45:01 7.67
2016-08-17 12:55:01 8.40
2016-08-17 13:05:01 11.02
2016-08-17 13:15:01 13.57
2016-08-17 13:25:01 10.07
2016-08-17 13:35:01 5.68
2016-08-17 13:45:01 3.20
2016-08-17 13:55:01 4.32
2016-08-17 14:05:01 2.40
cifsiostat
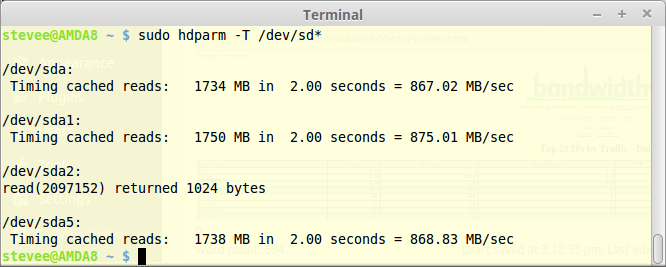
Hard drive cached reads: sudo hdparm -T /dev/sd*
stevee@Dell490 ~ $ sudo hdparm -t /dev/sd*
/dev/sda:
Timing buffered disk reads: 316 MB in 3.02 seconds = 104.77 MB/sec
/dev/sda1:
Timing buffered disk reads: 100 MB in 0.96 seconds = 104.44 MB/sec
/dev/sda2:
Timing buffered disk reads: 312 MB in 3.00 seconds = 103.97 MB/sec
/dev/sda3:
Timing buffered disk reads: 290 MB in 3.01 seconds = 96.24 MB/sec
/dev/sdb:
Timing buffered disk reads: 222 MB in 3.01 seconds = 73.76 MB/sec
/dev/sdb1:
Timing buffered disk reads: 222 MB in 3.01 seconds = 73.64 MB/sec
/dev/sdb2:
Timing buffered disk reads: read(2097152) returned 1024 bytes
/dev/sdb5:
Timing buffered disk reads: 114 MB in 3.04 seconds = 37.45 MB/sec
blkiomon EXAMPLES
To get I/O statistics for /dev/sdw every 10 seconds for a period of one
hour, use the following command:
% blktrace /dev/sdw -a issue -a complete -w 3600 -o - | blkiomon -I
10 -h -
sudo blktrace /dev/sda -a issue -a complete -w 20 -o iofile.txt
=== sda ===
CPU 0: 0 events, 0 KiB data
CPU 1: 1 events, 1 KiB data
Total: 1 events (dropped 0), 1 KiB data
Webpage graph
sudo apt-get install bandwidthd
browser address bar: /var/lib/bandwidthd/htdocs/index.html
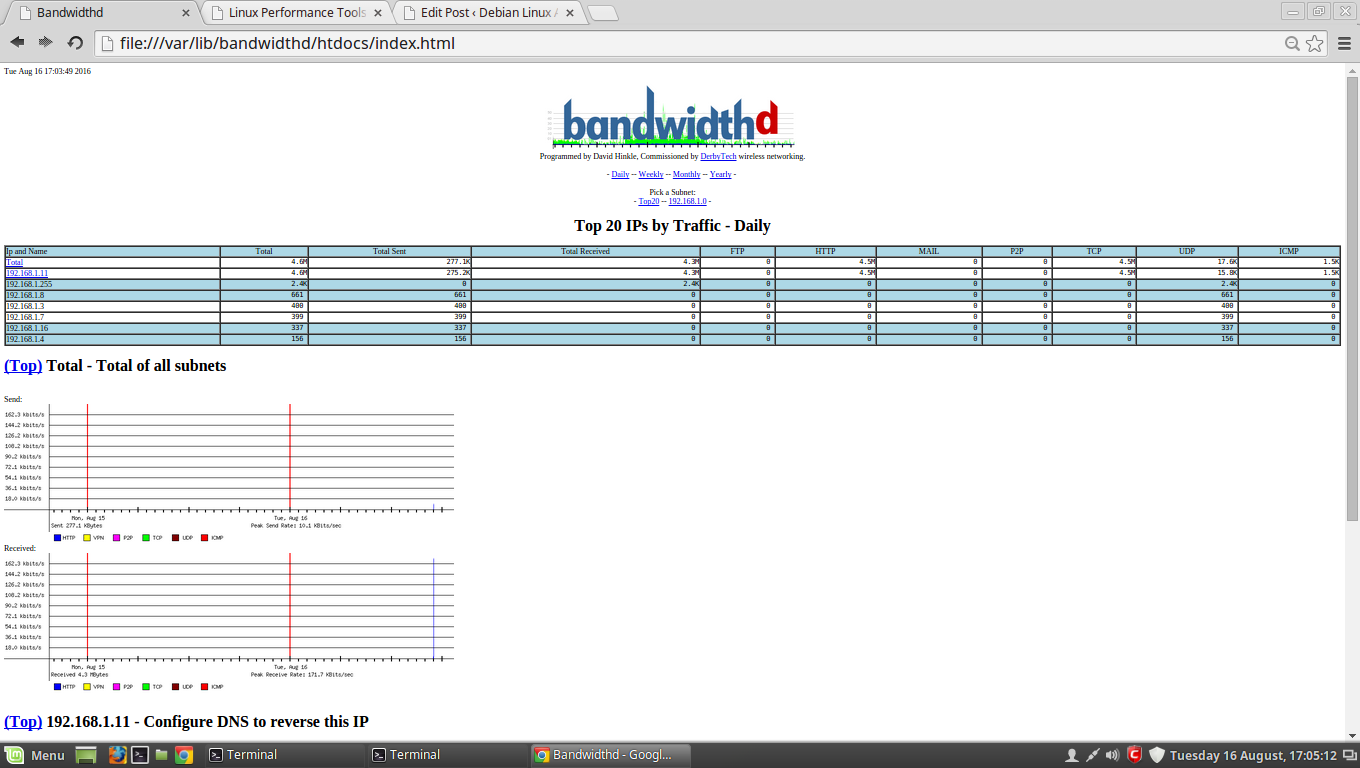
or add it as an alias in Apache in the virtual host block e.g. remote view it on your apache server //dellmint/bd
vi /etc/apache2/sites-available/000-default.conf
Alias /bd /var/lib/bandwidthd/htdocs
<Directory /var/lib/bandwidthd/htdocs>
Options All
AllowOverride All
order allow,deny
allow from all
</Directory>
INFO RE SYSTEMTAP!! You may need a development kernel with debugging installed/enabled! Most tutorials COMPLETELY fail to mention this - and you wonder why the cmd examples don't work!
see here: https://posulliv.github.io/2010/02/26/installing-stap/
"SystemTap needs to have a debug version of the kernel available. Unfortunately, installing the debug information for a kernel on ubuntu is not a trivial operation to perform. In fact, there is a bug on Launchpad about this issue."
If you want to experiment - use a test PC with a dev kernel...
If you HAVE installed just systemtap and systemtap-doc, the list of available probes can be seen with:
man probe::[TAB]
Display all 289 possibilities? (y or n)
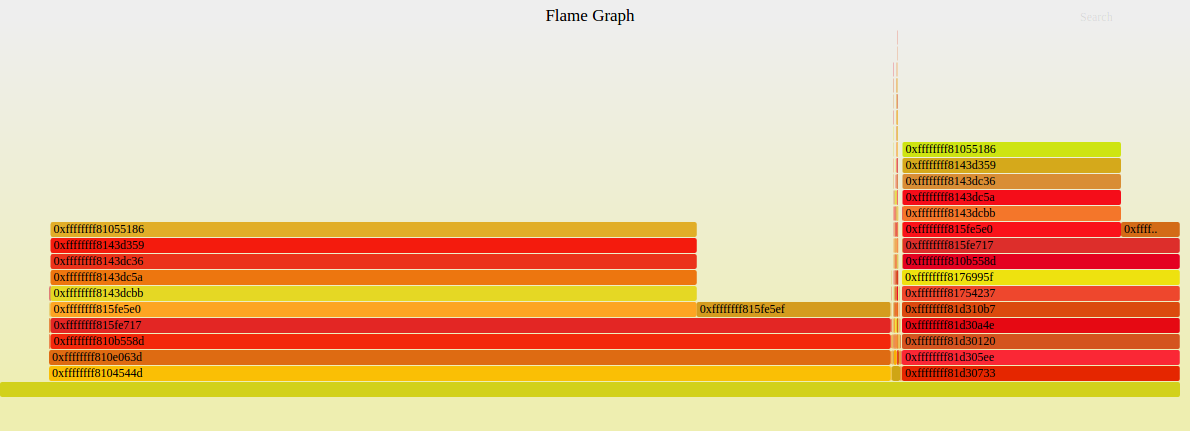
re the above stap kernel info - later, with my std kernel, I did get one of Brendan's stap cmds to work to create a flame graph in /Flamegraph as root (but much beyond this one cmd, it seems you need the full dev install a la suse link):
https://www.brendangregg.com/FlameGraphs/cpuflamegraphs.html#perf
stap -s 32 -D MAXBACKTRACE=100 -D MAXSTRINGLEN=4096 -D MAXMAPENTRIES=10240 \
-D MAXACTION=10000 -D STP_OVERLOAD_THRESHOLD=5000000000 --all-modules \
-ve 'global s; probe timer.profile { s[backtrace()] <<< 1; }
probe end { foreach (i in s+) { print_stack(i);
printf("\t%d\n", @count(s[i])); } } probe timer.s(60) { exit(); }' \
> out.stap-stacks
./stackcollapse-stap.pl out.stap-stacks > out.stap-folded
cat out.stap-folded | ./flamegraph.pl > stap-kernel.svg
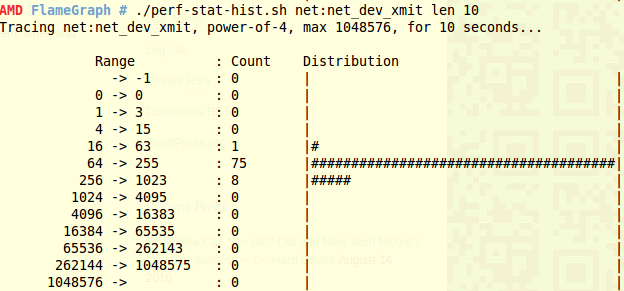
You can use perf for Brendan's script examples such as his "perf Hacktogram"
https://www.brendangregg.com/blog/2014-07-10/perf-hacktogram.html
in your Flamegraph directory (previous Post) as root - create this histogram in the terminal: